library(ggplot2)
library(tidyverse)
library(hrbrthemes)
library(showtext)
library(rsvg)
library(ggimage)
library(cropcircles)
library(ggrepel)2022 Week 36: LEGO Sets
This week I eschewed a scientific format, and instead tried to create an infographic that might be included in a LEGO magazine, complete with pictures and bold colours.
Setup
font_add_google("Roboto Condensed")
showtext_auto()
Load Data
sets <- readr::read_csv(
  'https://raw.githubusercontent.com/rfordatascience/tidytuesday/master/data/2022/2022-09-06/sets.csv.gz')

themes <- readr::read_csv(
  'https://raw.githubusercontent.com/rfordatascience/tidytuesday/master/data/2022/2022-09-06/themes.csv.gz')
Clean Data
lego <- left_join(sets, themes, by = c("theme_id" = "id"))safe_image <- possibly(circle_crop, otherwise = NA)
lego <- lego |>
filter(num_parts > 0) |>
arrange(year) |>
group_by(name.x) |>
slice(1) |>
ungroup() |>
arrange(year) |>
mutate(ATH = ifelse(num_parts >= cummax(num_parts),
TRUE, FALSE)) |>
filter(ATH == TRUE) |>
group_by(year) |>
arrange(num_parts) |>
slice(1) |>
ungroup() |>
mutate(yadj = rep(c(2500, -2500), length.out = 17),
yadj = yadj + 17500/80*(year-1949)) |>
rowwise() |>
mutate(img = safe_image(img_url)) |>
ungroup() |>
group_by(is.na(img)) |>
mutate(n = n(),
yadj = rep(c(1000, 6000, 9000), length.out = n),
yadj = yadj + num_parts,
yadj = ifelse(is.na(img), 0, yadj))Warning in rep(c(1000, 6000, 9000), length.out = n): first element used of
'length.out' argument
Warning in rep(c(1000, 6000, 9000), length.out = n): first element used of
'length.out' argumentPlot
legoPlot <- lego |>
    ggplot(aes(x = year, y = num_parts)) +
    geom_line() +
    geom_area(fill = "#DD1A21") +
    geom_segment(aes(x = year, xend = year, y = num_parts, yend = yadj)) +
    geom_image(aes(image = img, y = yadj, x = year),
               size = 0.12, inherit.aes = FALSE) +
    ylim(0, 21000) +
    scale_colour_viridis_d() +
    scale_x_continuous(expand = expansion(add = 9),
                       breaks = seq(1950, 2020, by = 10)) +
    theme_ipsum_rc() +
    theme(legend.position = "bottom",
          axis.text = element_text(colour = "black"),
          axis.title.x = element_text(size = 14),
          axis.title.y = element_text(size = 14),
          plot.background = element_rect(fill = "#FFCD03", color = NA),
          panel.grid.major = element_line(colour = "black"),
          panel.grid.minor = element_blank()) +
    xlab("Year of Release") +
    ylab("Number of Parts") +
    ggtitle("The Biggest and Best LEGO Sets (1949-2021)",
            "A timeline of LEGO sets that set new records for part numbers.
Data from rebrickable.")

tmp <- tempfile()
ggsave(tmp, legoPlot, device = "svg", width = 7, height = 7)
rsvg_png(tmp, "Out/2022-09-06.png")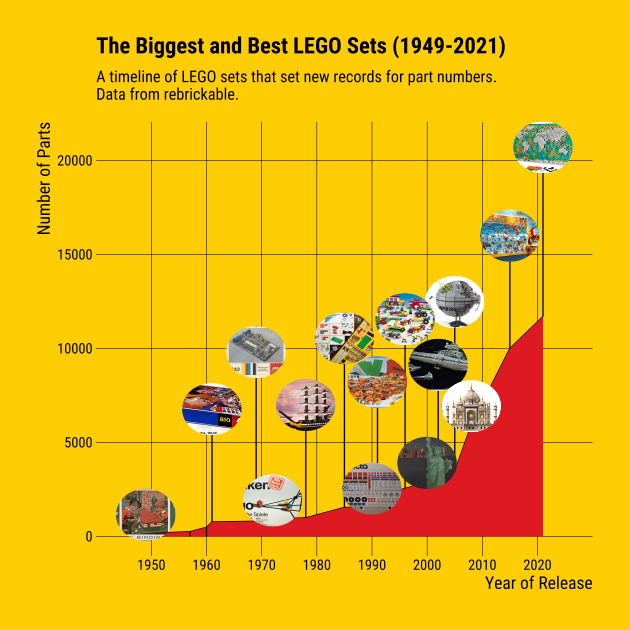
Session Info
sessionInfo()R version 4.2.1 (2022-06-23 ucrt)
Platform: x86_64-w64-mingw32/x64 (64-bit)
Running under: Windows 10 x64 (build 19043)
Matrix products: default
locale:
[1] LC_COLLATE=English_Australia.utf8 LC_CTYPE=English_Australia.utf8
[3] LC_MONETARY=English_Australia.utf8 LC_NUMERIC=C
[5] LC_TIME=English_Australia.utf8
attached base packages:
[1] stats graphics grDevices utils datasets methods base
other attached packages:
[1] ggrepel_0.9.1 cropcircles_0.1.0 ggimage_0.3.1 rsvg_2.3.1
[5] showtext_0.9-5 showtextdb_3.0 sysfonts_0.8.8 hrbrthemes_0.8.0
[9] forcats_0.5.2 stringr_1.4.1 dplyr_1.0.9 purrr_0.3.4
[13] readr_2.1.2 tidyr_1.2.0 tibble_3.1.7 tidyverse_1.3.2
[17] ggplot2_3.3.6
loaded via a namespace (and not attached):
[1] fs_1.5.2 lubridate_1.8.0 bit64_4.0.5
[4] httr_1.4.4 tools_4.2.1 backports_1.4.1
[7] utf8_1.2.2 R6_2.5.1 DBI_1.1.3
[10] colorspace_2.0-3 withr_2.5.0 tidyselect_1.1.2
[13] bit_4.0.4 curl_4.3.2 compiler_4.2.1
[16] extrafontdb_1.0 textshaping_0.3.6 cli_3.3.0
[19] rvest_1.0.3 xml2_1.3.3 labeling_0.4.2
[22] scales_1.2.1 systemfonts_1.0.4 digest_0.6.29
[25] yulab.utils_0.0.5 svglite_2.1.0 rmarkdown_2.16
[28] pkgconfig_2.0.3 htmltools_0.5.2 extrafont_0.18
[31] dbplyr_2.2.1 fastmap_1.1.0 htmlwidgets_1.5.4
[34] rlang_1.0.4 readxl_1.4.1 rstudioapi_0.14
[37] farver_2.1.1 gridGraphics_0.5-1 generics_0.1.3
[40] jsonlite_1.8.0 vroom_1.5.7 googlesheets4_1.0.1
[43] magrittr_2.0.3 ggplotify_0.1.0 Rcpp_1.0.8.3
[46] munsell_0.5.0 fansi_1.0.3 gdtools_0.2.4
[49] lifecycle_1.0.1 stringi_1.7.6 yaml_2.3.5
[52] grid_4.2.1 parallel_4.2.1 crayon_1.5.1
[55] haven_2.5.1 hms_1.1.2 magick_2.7.3
[58] knitr_1.40 pillar_1.8.1 reprex_2.0.2
[61] glue_1.6.2 evaluate_0.16 ggfun_0.0.7
[64] modelr_0.1.9 vctrs_0.4.1 tzdb_0.3.0
[67] Rttf2pt1_1.3.10 cellranger_1.1.0 gtable_0.3.1
[70] assertthat_0.2.1 xfun_0.31 broom_1.0.1
[73] ragg_1.2.2 googledrive_2.0.0 gargle_1.2.0
[76] ellipsis_0.3.2